
Analytics
Per-module dashboards showing how your Hub is doing, and the settings that shape them.
The dashboards
Analytics gives your staff a dashboard for each part of the Hub. They all live together in the Analytics group of the Hub panel sidebar:
| Dashboard | Where | What it shows |
|---|---|---|
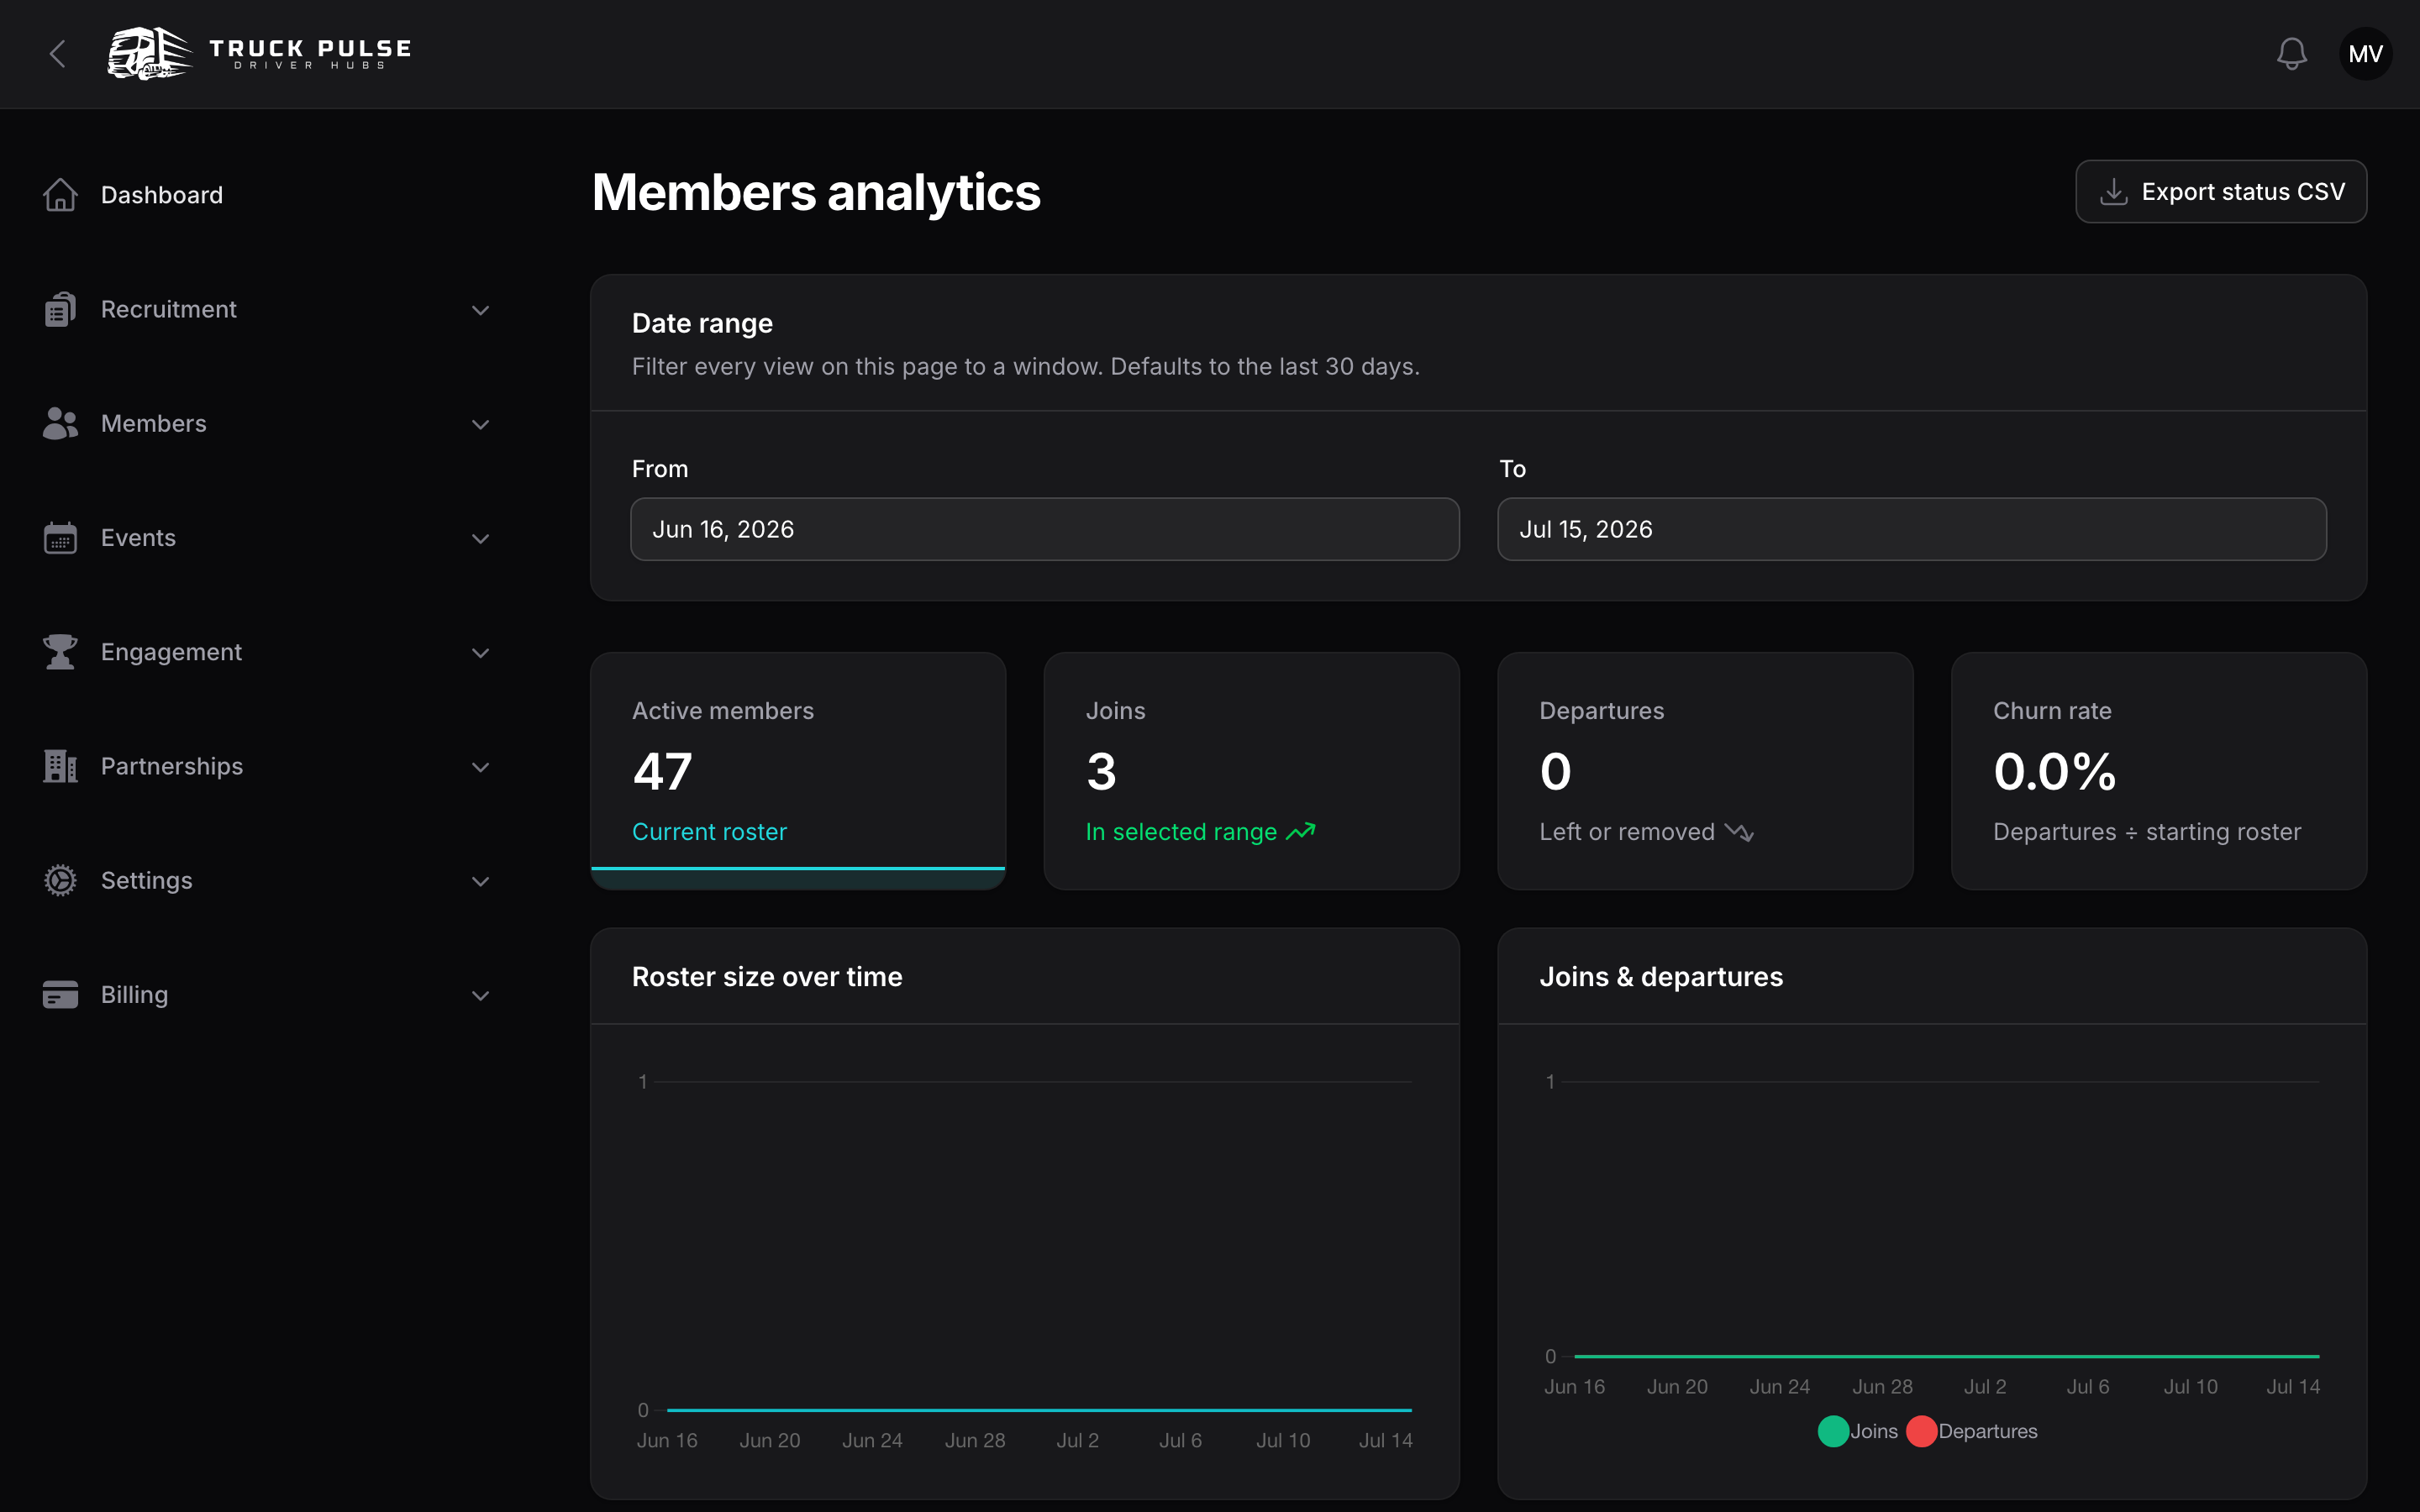
| Members analytics | Analytics → Members | Roster size over time, joins and departures, churn rate, membership status, departure reasons and rank distribution. |
| Applications analytics | Analytics → Applications | Submissions over time, acceptance rate, average time to decision, drop-off by status and where applications come from. |
| Events analytics | Analytics → Events | Average attendance, no-show rate, RSVPs and attendance over time, best days and hours, and RSVP-to-attendance conversion by event type. |
| Slot bookings analytics | Analytics → Slot bookings | Bookings over time, approval rate, average time to fill and repeat-booker companies. |
| Goals analytics | Analytics → Goals | Goal completions, rewards issued, on-track distribution and completion rate per goal. |
| Competitions analytics | Analytics → Competitions | Active boards, ranked drivers and participation per board. |
| Points analytics | Analytics → Points | Points awarded over time and by source, members earning points, promotions and campaign impact. |
| Driving analytics | Analytics → Driving | Average driving score, clean delivery rate, behaviour events and the score distribution across drivers. |
| Trucky analytics | Analytics → Trucky | Deliveries, distance driven, active drivers and deliveries by hour, from your Trucky link. |
| Discord analytics | Analytics → Discord | Notification delivery success rate, volume and failures by event type for your Discord bot. |
Every dashboard has a Date range filter with From and To dates — it defaults to the last 30 days and every chart and table on the page follows it, using your Hub's timezone. Competitions analytics is the exception: it shows current standings rather than a window. Each dashboard also has an Export … CSV button for its headline table.
When the numbers update
The charts and headline numbers — on these pages and on the Hub dashboard — are a nightly snapshot, rebuilt once a day in the early morning (03:30 UTC). A driver you accept this morning counts in the roster straight away, but appears on the graphs after the next rebuild.
To see today's changes sooner, choose Refresh analytics at the top of the Hub dashboard or any analytics page. It rebuilds yesterday and today in the background; reload the page a minute or two later. Each Hub can refresh once every 10 minutes. A few views are computed live rather than from the snapshot — membership status, rank distribution and the competition standings — so they never lag.
Who can see them
All dashboards are gated by the single "View analytics" permission — grant it to a role and that role sees every dashboard your Hub has turned on. See Roles & permissions.
The Inactivity report under Members is related but separate: it's part of the roster tools and follows team-management access instead — see Members & roster.
Analytics settings
Settings → Analytics shapes both the staff dashboard widgets and which analytics pages appear in the sidebar.
Inactivity — used by the inactivity report and nudges:
| Setting | Default |
|---|---|
| Inactivity threshold (days) — days without a delivery or event before a driver counts as inactive | 30 |
| Exclude approved-leave days from inactivity | On |
Inactivity nudge message — sent when staff nudge an inactive driver; supports {{ driver }}, {{ hub }} and {{ days }} |
A friendly come-back note |
Staff dashboard widgets — each widget on the Hub panel dashboard can be turned off: at-a-glance vitals, active drivers, membership growth, Trucky activity chart, goal completions chart, events activity, points awarded and top contributors. All are on by default.
Dashboards — each analytics page has its own toggle (Show members analytics, Show events analytics and so on, all on by default). Turning one off hides it from the sidebar for everyone — useful for modules your Hub doesn't use.